
In 2024, 81% of customers said they prefer companies that offer a personalized experience.
The Alchemy
Building the Profiles
The Experience Profiles™ are structured around four quadrants of behavior and preference for how people engage with the experiences we create:
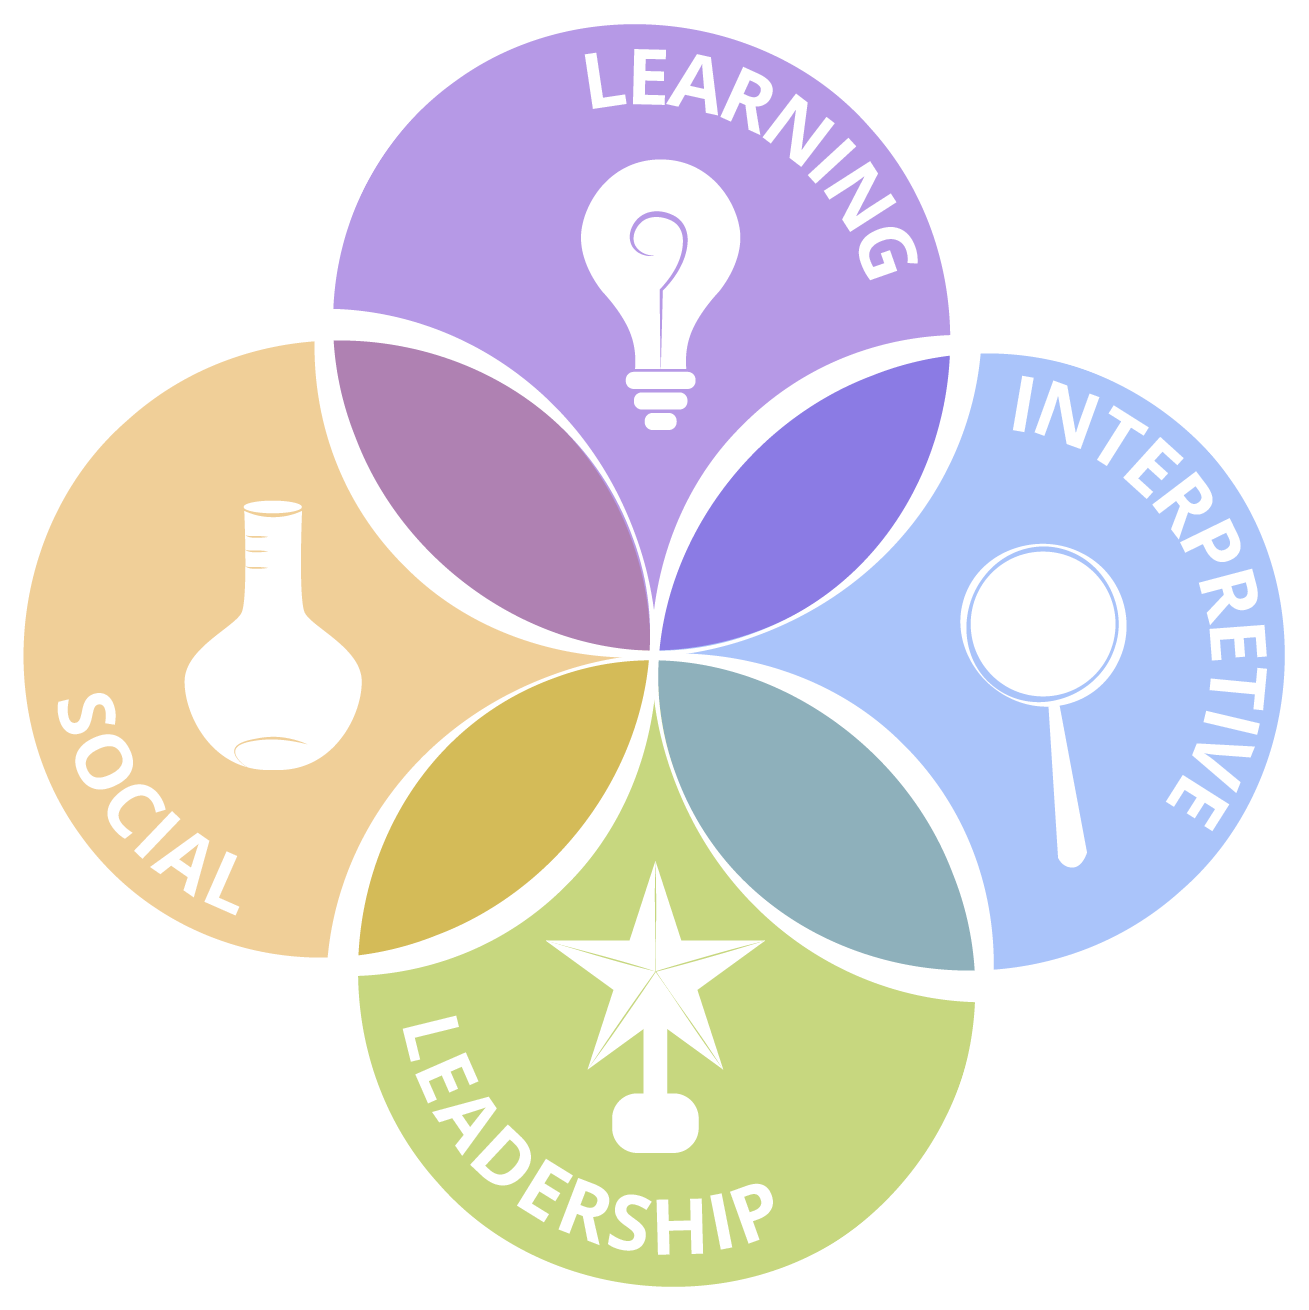
The Experience Profiles™ highlight the diverse ways people engage with the world around them. They're not about labeling or limiting individuals, but about encouraging self-reflection and understanding.
For those who design experiences, the Experience Profiles™ offer valuable insights into how to create inclusive and engaging events that resonate with a wide range of preferences.
The Quadrants in Detail
How do we interact socially?
-
Social Preferences are about how we consider experiences in the context of our interactions with others. Your social preferences influence how you interact with others, how you engage with content, and even how you connect with brands.

How do we connect with content?
-
Interpretive Preferences refer to the different ways we understand and connect with information. These preferences help us figure out what draws us to an experience, what sticks with us, and what makes us change our minds. It's about how we take in information, make sense of it, and decide what's important to remember and share. Ultimately, it shapes how we see the world and how we apply new knowledge to our lives.
How do we process information?
-
Learning Preferences help us understand how people absorb and process information. This understanding empowers event attendees to choose the educational journeys that best suit their needs. For those who create learning experiences, understanding these preferences allows them to design inclusive learning options and provide materials that allow all minds to shine.
How do we relate to our teams?
-
When looking at Leadership Preferences, we found many different ways to describe them. We wanted to avoid any approaches that categorized leaders in a negative way or claimed to know the "best" way to lead. Instead we focused on how both leaders and their teams view leadership, understanding that this can change from generation to generation. We drew from several sources that focused on positive leadership qualities, such as emotional intelligence, strong values, and a focus on mission.